BAOC
Score calculation methodology
Note: (BAOC 2008 Sprint season is used as example
but methodology is not limited to it)
External links:
http://www.attackpoint.org/discussionthread.jsp/message_149323
discussion about GV calculation
http://www.geocities.com/nikdangerdvm/03methods.html
- original write-up of the GV algorithm calculations.
Methodology
was called by many people as cumbersome and I
will try to explain here in my words. I will quote the Methodology where applicable and explain
practical application details
Originally
Adopted for USOF from
Wyatt Riley's BAOC ranking rules, 1999. One more time adopted
by S.
Kretchetov starting from here http://www.geocities.com/nikdangerdvm/03methods.html
Algorithm flow and definitions
There
are four items here and they
all depend on each other. Must be consumed as a whole dish. Don’t get
disappointed until done reading.
NOTE:
Algorithm makes no sence to implement if there is only one race. Two or
more races must be present.
- Runner
Local Power (RLP) =
Race Gnarliness Value (GV) divided by Runners Time (RT) Example:
- Race GV is 5000
- your
time was 1:40:00 or
100 minutes.
- Your RLP
for that race is
5000/100 = 50.
- Runner
Global Power (RGP)
=
plain average of Runner Local Power (RLP) over all races
Example - Your Race#1 RLP = 50
- Your Race#2 RLP = 70
- Your RGP = (50+70)/2 = 60
- Runners
Race Difficulty (RRD) = Runner
Global Power (RGP) multiplied
by Runners Time (RT)
Example:
- If your RGP = 60
- your RT = 80 minutes
- your RRD would be 60*80=4800
- Race
Gnarliness Value (GV) = harmonic average
(reciprocal of average
of reciprocal values ) of Runners Race Difficulties (RRD) for all
runners in current race.
This value only has sence if there are more
then one race.
Example: - John
has RGP = 100 and
runs RACE in 30 min. (RRD = 100 * 30 = 3000)
- Mary
has RGP = 60 and
runs RACE in 100 min. (RRD = 60
* 100 = 6000)
- 1/
GV = ½ (1/(100*30) + 1/(60*100))
= 1/4000
- GV
= 4000
Some
observations:
- If
you are on average twice as fast as somebody, you should end up with
about twice their score.
Practical
Implementation details.
- Input
data for the algorithm are three columns: Person, Race and Time. No other information is
needed
- All
valid finishes of the season must be used. Valid finishes are times
(not OT, DNF, MSP, etc...).
- Algorithm
is recursive over items 1-4. Must be stopped after next iteration
changes results by negligible amount.
- Initial
conditions are only Runner Local Power (RLP) which can be set to any
positive nonzero number
- Algorithm
converges to the same point independently on initial conditions. For
simplicity all
runners can be given RLP =
100 at first step
- Algorithm
is linear relative to initial conditions. Meaning that if all initial RLP are increased by
factor F, the resulting GV, and RGP will be increased by the same
factor.
- The
only nontrivial output of the algorithm is set of GV, which is one
number per race. The rest of the results can be immediately derived
from GV and Runners Times (RT)
Analysis
of the results:
Anywhere below
when I say Score I mean RGP Runner Global Power. If
some other scoring system is used I say USOF Score or BAOC
Score.
As was mentioned above,
algorithm is linear and resulting
values can float anywhere from 1 to 100 or even 100000. Only ratios will preserve: If you run
twice faster then me, your score will be twice larger then
mine. So the question of normalization arises.
- Original
proposal of the USOF officials was to take top 3
runners and make average of these three runners scores equal to
100. This method has a
serious drawback.
- If we have one runner who is 10 % faster then two closest
competitors, he will always have ~107 points (and the top 3 will always
look
like (107+ 97+96)/3 = 100
- If suddenly we got another fast runner of the same
caliber, situation changes and we have now trio of (104 +104 +
92)/3 = 100.
This is actual
situation and happened all the time in last BAOC season.
Such
fast and pointless recalibration moves everybody in the rest of the
pack and makes actual value of a score not very valuable. - I propose the following way to normalize scores.
- Take all scores from people who ran at least once and
normalize scores so that average score of all runners would be 50 ( Reasonable?)
- Technically,
this can lead to all kind of unpredictable results. F.e if
our
fastest runner is 4 times faster than average member of a club, he
would get score of 200 (50*4).
- But practically, I took all ~300 people who ran BAOC Sprints in the 2008 and plotted
them
on the Ranking curve presented below.
- Curve is plotted in college-like % below style.
- Along X-axis is runner's score
normalized as explained and along Y-axis is percentage of
people who have score below.
- Chart shows that
- Runner with score 30 will pass 15% of fellow runners if all running same track.
- Runner with score 80 is better then 95% of the runners
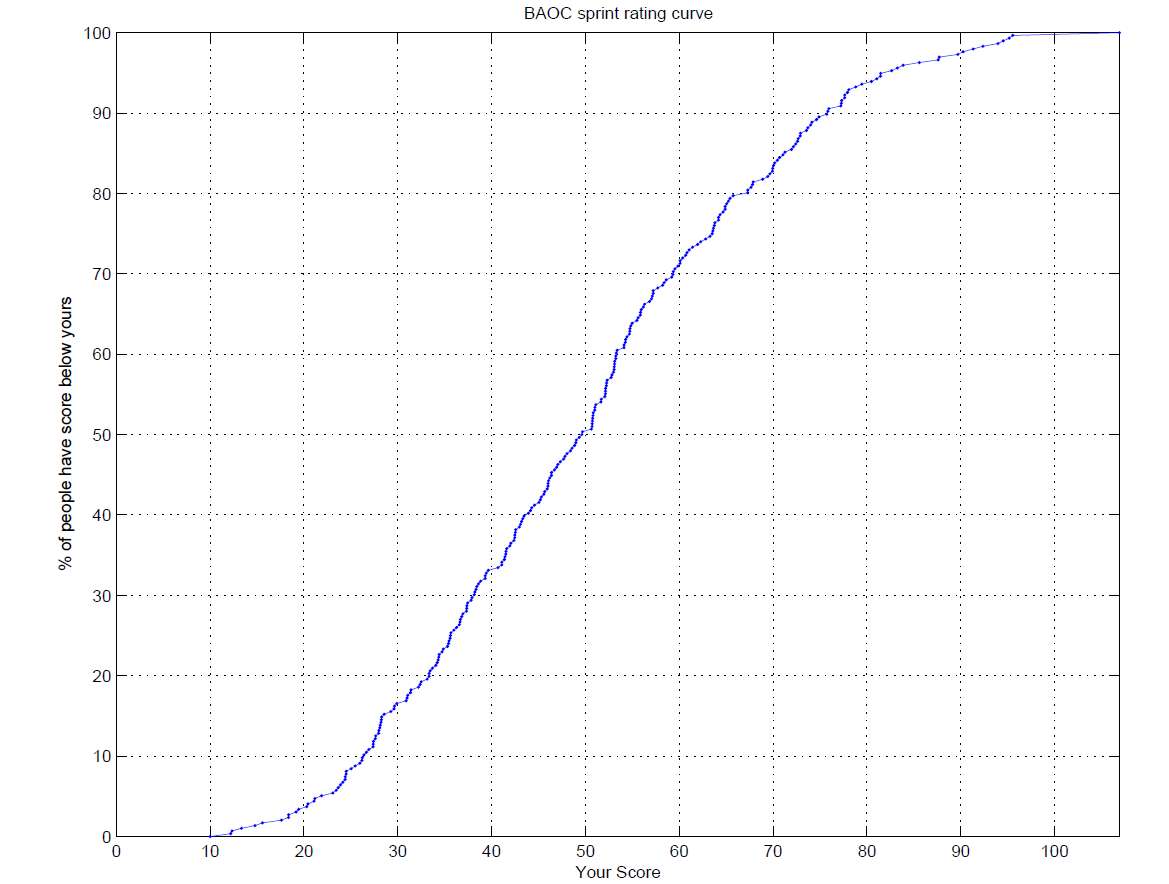
- The curve
is almost ideally symmetrical around 50% point. It means that
approximately half of the runners are faster then average and half of
the runners are slower then average
- It happened so that 3 fastest runners in the list are approximately 2
times faster than average runner and therefore have scores around 100
- And it also
happens that average score of this 3 runners is 99.
|
Name
|
Score |
| 1 |
Eddie
Bergeron |
106.9112 |
| 2 |
Erik
Nystrom |
95.5410 |
| 3 |
Sergey
Velichko |
95.1596 |
- Note: I did Nothing to make it happen.
Benefits of 50% average score normalization
- Produces very stable scores if large number of people is taken into account.
- Does not depend on top 3 runners performance.
- Allows
effective comparison of the top Club runners relative to the
Outside World ( Provided that at least one A-meet happened during the
season)
- Example:
Our
top qualified runners of last season Rex, Francois and Steve Greg
currently have score of 78.0, 85.5 and 74 correspondingly (see table below), which puts
them at top 10% (see chart above) of all runners. They would have scores 99, 108 and 93 if normalized using old method. - How will runner perform on national Level? Here is the answer: Compare predicted and actual scores for the BAOC runners at the last year's Northstar Event.
Note
that Both Francois and Rex run close to their scores during the
event where a lot of high level runners were present. (Ben apparently is still underestimated still in our Sprint Series) If normalized to 100 points for the best runner, our runners would never knew their real level. - In the meantime it also helps middle pack runners, such as Toby and Alex, realize their real USOF level (~60) instead of ~80 points as they would have otherwise.
| Name | Northstar performance | Normalized to 50% RGP | Normalized to top 3 RGP |
| Alex Finch |
57.79 |
60.1 | 75.9 |
| Ben Legg |
91.50 |
83.2 | 105.2 |
| Francois Leonard |
87.64 |
85.6 | 108 |
| Rex Winterbottom |
81.52 |
78.1 | 98.6 |
| Toby Ferguson |
61.02 |
62.3 | 78.7
|
- If applied to the rest of the courses (White -Blue), this
sytem, allows to estimate GV of the courses more accurately while
preparing for the A-meets
(The "ideal" GV at the lower end of the USOF standard are: 1500 for Sprint, 4500 for
Brown, 5000 for Green, 6000
for Red, and 7500 for Blue.
BAOC and/or USOF "practical" Score calculation
Here
mathematics and statistics fade away and politics comes. Some
people run 1 time, some ran 12 times. How to compare them?
Following paragraphs summarize current systems and open discussion for
a new ones.
NOTE: One thing is more or less stable in all below-mentioned systems. They take Runner
Local Power (RLP) and play with it
For those who skippend above discussion
Runner
Local Power (RLP) AKA "Your Score for an individual race" = Race Gnarliness (GV) divided by Runner Time in minutes (RT)
- USOF system proposes following
- Runner
Local Power (RLP) calculated according to the above described USOF procedure. Normalization doesn't matter
- If
you run 4 or fewer races, then all of your races are averaged together.
If you run more than four races,
you get to throw out one low score for every two additional races.
- For example, if you
run 6 races, then you get to throw out (6-4)/2 = 1 score (your lowest)
and the remaining
(top 5) scores are averaged.
- The scores
are normalized (multiplied by a constant) so that the top three
finishers average 100
points.
Note
(SK): This normalization only takes into account Those Who Qualified.
Fast runner with only one race would automatically be excluded.
Main
Difference of BAOC system from USOF is that Course Setters are rewarded
with their ONE MAX score for current season. This score is
treated as valid running score and counts for qualification- BAOC simplified system. (Proposed By Rex Winterbottom originally)
- Winner of each race gets 100 points.
- Remaining runners get RT_winner/ RT_runner * 100
- Best 5 races count and are required for qualification (Including Course Setter Bonus)
- At the end of the season results are normalized so that top 3 got 100 points
- BAOC slightly advanced system. Used in 2008 (Combination of USOF and BAOC simplified, proposed by Shura Kretchetov)
- Runner
Local Power (RLP) calculated according to the above described USOF procedure. Normalization doesn't matter
- Best 5 races count and are required for qualification (Including Course Setter Bonus)
- /At the end of the season results are normalized so that top 3 got 100 points
- BAOC/ advanced system. Proposed for 2009 BAOC Sprint (and other?) Series. Proposed for usage in USOF in part of score normalization (proposed by Shura Kretchetov)
- Runner
Local Power (RLP) calculated according to the above described USOF procedure.
- Scores normalized so that average score for all runners is 50
- Best 5 races count and are required for qualification (Including Course Setter Bonus)
- At
the end of the season no normalization is done. Results show
actual runners performance relative are normalized so that top 3 got
100 points
FAQ
Q: Can anybody have score over 100
A: Yes,.
- Current system normalizes 3 top runners to have 100 on average, which makes one or two of them always above 100.
- In
the system I'm proposing,t he only reference point is average
person, who will always have score 50. If somebody runs 3 times faster
than average he will have score of 150.
Q: How Can I evaluate my performance in a race?
A: Take Race GV and divide by your time to get RLP. Then
compare result with your overall power RGP. If local score
is higher - you outperformed yourself.
Example: Runner G.M. Outperformed himself at Oyster Bay by a lot. His expected time was 1323/57 =
23.2 minutes and he finished almost 4 minutes faster. Great
Performance!
| First/Last name |
Time, min |
Park |
Normalized Race Gnarliness |
Personal Performance score |
Runner personal Rating |
| G. M. |
19.68333 |
0901_Oyster_Bay |
1323.568 |
67.24306 |
57.04602 |
APPENDIX
Gnarliness values for recent BAOC Sprint Races
| Park |
Race Gnarliness |
| 0801_Bayfront |
1092.95 |
| 0802_Pt. Pinole |
1092.408 |
| 0803_Stanford I |
1439.457 |
| 0804_Indian Valley |
1857.387 |
| 0805_AmRiver Pkwy S |
2461.382 |
| 0806_Golden Gate |
2143.64 |
| 0807_Northstar |
1419.781 |
| 0808_Lakeside |
916.7627 |
| 0809_Knowland Park |
1408.308 |
| 0810_Berkeley |
1471.755 |
| 0811_Crown Beach |
940.3821 |
| 0812_Vasona |
1425.115 |
| 0813_Joe Grant |
1138.849 |
| 0814_Stanford II |
2225.825 |
| 0901_Oyster_Bay |
1323.568 |
| 0902_Bayfront |
1427.328 |
| 0903_PPinole_Pr |
1140.005 |
| 0904_PPinole_Ch |
1251.341 |
List of all runners 2008-2009 BAOC Sprint Season up to Point Pinole Sprint 2009/02/2. RGP is
normalized to have 50 on average over all Runners
| Name |
Runner Global Power |
Number of Races |
| Eddie Bergeron |
106.911215 |
1 |
| Erik Nystrom |
95.541044 |
1 |
| Sergey Velichko |
95.15958 |
1 |
| Lehel Fenyo |
94.526028 |
1 |
| Eric Bone |
93.964459 |
1 |
| Jonathan Campbell |
92.373516 |
1 |
| Leif Anderson |
91.327124 |
1 |
| Memund Daltveit |
90.259437 |
1 |
| Oyvind Naess |
89.689257 |
1 |
| Jonas Kjall |
87.707426 |
3 |
| Magnus Johansson |
87.603788 |
1 |
| Francois Leonard |
85.585951 |
8 |
| Michael Norris |
83.862242 |
1 |
| Ben Legg |
83.244782 |
5 |
| Andy Dale |
82.641498 |
1 |
| Joe Brautigam |
81.46275 |
1 |
| Scott Porter |
81.441875 |
1 |
| Jason Trump |
81.056885 |
1 |
| Wyatt Riley |
80.479021 |
2 |
| Huw Stradling |
79.450528 |
1 |
| Michael Rodriguez |
78.813096 |
1 |
| Rex Winterbottom |
78.079087 |
12 |
| Greg Khanlarov |
77.935427 |
2 |
| Jordan Laughlin |
77.631168 |
1 |
| Patrick Nuss |
77.626555 |
2 |
| John Kewley |
77.303991 |
1 |
| Amos Meeks |
77.288021 |
1 |
| Malcolm Wyatt-Mair |
77.225537 |
2 |
| Mikkel Conradi |
75.948345 |
4 |
| Niklos Weber |
75.842999 |
1 |
| Roger Michel |
75.715489 |
1 |
| James Scarborough |
74.893707 |
1 |
| Wesley Willett |
74.632631 |
1 |
| Ludwig Hill |
74.139997 |
1 |
| Steve Gregg |
73.993257 |
9 |
| John Campbell |
73.711925 |
1 |
| Tomer Maymon |
73.557367 |
2 |
| Martin Kunz |
72.92442 |
1 |
| Andrey Poletayev |
72.884032 |
1 |
| Blas Lopez |
72.671658 |
5 |
| Brad Carter |
72.620724 |
1 |
| Daniel Keyser |
72.399825 |
1 |
| Henrik Pedersen |
72.180017 |
1 |
| Charlie Shahbazian |
71.960514 |
1 |
| Nickolaus Fuhriman |
71.267161 |
1 |
| Nicholas Lewis-Walls |
71.044868 |
1 |
| Ido Green |
70.697832 |
5 |
| Tapio Karras |
70.448595 |
12 |
| Paul Caston |
70.169392 |
1 |
| Andrejus Masalkovas |
70.048488 |
3 |
| Joshua Wiley |
69.953885 |
1 |
| Paul Murgatroyd |
69.939948 |
1 |
| Alex Kiperman |
69.665404 |
1 |
| Tom Strat |
69.442027 |
1 |
| Viktoria Brautigam |
68.895901 |
1 |
| Dennis Wilkinson |
67.885107 |
4 |
| Dave Enger |
67.80572 |
1 |
| Stephen Pepe |
67.636926 |
3 |
| Igor Guskov |
67.310039 |
1 |
| Travis Parker |
67.288196 |
1 |
| Kimball Forrest |
65.75342 |
1 |
| Derek Maclean |
65.40782 |
4 |
| Dennis Wildfogel |
65.236679 |
10 |
| Dean Sturtevant |
65.051011 |
2 |
| Nik Weber |
64.891695 |
1 |
| Rich Parker |
64.88944 |
1 |
| Matthias Kohler |
64.679781 |
8 |
| Cameron Ferguson |
64.354804 |
6 |
| Michael Huber |
64.185395 |
1 |
| Piers Newbery |
64.183773 |
1 |
| John Hensley Williams |
63.801078 |
1 |
| Chuck Houck |
63.753073 |
1 |
| Brad Wetmore |
63.64922 |
6 |
| Ole Bergset |
63.581771 |
1 |
| Russell Neilson |
63.516744 |
2 |
| Mike Prindiville |
63.286043 |
1 |
| Deron van Hoff |
62.808746 |
2 |
| Toby Ferguson |
62.296539 |
9 |
| Alison Campbell |
61.96133 |
1 |
| Kent Ohlund |
61.417197 |
4 |
| Manfred Kopisch |
61.056285 |
7 |
| Werner Haag |
60.827486 |
6 |
| Alan Vyse |
60.673907 |
1 |
| Paul Carson |
60.352371 |
1 |
| Alex Finch |
60.094507 |
9 |
| Javson Rickel |
60.083832 |
1 |
| Steve Smith |
59.853774 |
2 |
| Ellyn Brown |
59.532109 |
1 |
| Dick Hawkins |
59.376916 |
1 |
| Giovanni Visette |
59.330587 |
1 |
| Jonas Libell |
59.196297 |
1 |
| Jim Waite |
58.620187 |
1 |
| Charlie DeWeese |
58.402525 |
1 |
| Anne Daltveit |
58.235477 |
1 |
| Matej Sebo |
57.711196 |
2 |
| Steve Haas |
57.228529 |
3 |
| Chuck Spalding |
57.22222 |
1 |
| Dan Greene |
57.139151 |
8 |
| George Minarik |
57.046021 |
12 |
| Victoria Campbell |
56.836707 |
1 |
| Bevan Waite |
56.295834 |
1 |
| Robert Huebner |
56.184446 |
1 |
| Yamay Chang |
55.952672 |
1 |
| Lubomir Sebo |
55.877292 |
3 |
| Bruce Wolfe |
55.861713 |
3 |
| Steve Harrison |
55.61064 |
11 |
| Mal Harding |
55.472442 |
1 |
| Peter McNamara |
54.977792 |
1 |
| Sharon Crawford |
54.833886 |
2 |
| Theo Verhoeven |
54.748926 |
1 |
| Bob Strauss |
54.732417 |
2 |
| Fyodor Konkov |
54.688924 |
9 |
| Andy Belk |
54.425635 |
2 |
| Rick Armstrong |
54.296851 |
1 |
| Philipp Kopisch |
54.266298 |
6 |
| James Wilson |
54.123323 |
4 |
| Mike Poulsen |
54.102102 |
1 |
| Frank Markowitz |
53.372527 |
1 |
| Don Atkinson |
53.306559 |
2 |
| Lauren Knight |
53.235508 |
1 |
| Alex Kerr |
53.235131 |
1 |
| Daniel Kopisch |
53.128159 |
5 |
| Margaret Longstreth |
53.107384 |
1 |
| Pete Olsten |
53.080626 |
2 |
| Joe Saba |
53.065474 |
2 |
| Marie-Josee Parayre |
52.998282 |
8 |
| Kelsey Wyatt-Mair |
52.838889 |
1 |
| Emil Huber |
52.740748 |
1 |
| Jerry Young |
52.312781 |
1 |
| Gary Kraght |
52.250433 |
3 |
| Peter Olsten |
52.236238 |
1 |
| Mike Chin |
52.140321 |
1 |
| Wayne Caplinger |
52.136039 |
5 |
| Chris Nelsen |
52.130317 |
1 |
| Gavin Wyatt-Mair |
52.076286 |
8 |
| Chris Whitmore |
51.684781 |
1 |
| Bob Landry |
51.655446 |
1 |
| Damian Swift |
51.113271 |
2 |
| Josh Schloesser |
51.000862 |
1 |
| Joe Maffei |
50.999824 |
5 |
| Chris Hann |
50.833546 |
1 |
| Sarah Minarik |
50.807054 |
3 |
| Shura Kretchetov |
50.757428 |
9 |
| Anand Varma |
50.750189 |
1 |
| Bob Cooley |
50.722802 |
5 |
| Matthew Cochran |
50.718772 |
1 |
| Greg Favor |
50.640724 |
2 |
| Mark Blair |
49.684466 |
9 |
| Dan Felitsky |
49.627251 |
2 |
| Dan Vermillion |
49.354644 |
1 |
| Allen Hubsch |
49.024935 |
1 |
| Dale Width |
48.991751 |
1 |
| Bill Meldrum |
48.841914 |
1 |
| Luc Poppe |
48.576661 |
2 |
| Madeline Lewis |
48.399883 |
1 |
| Stephanie Maclean |
48.048388 |
6 |
| Ardis Dull |
47.828741 |
2 |
| Clare Durand |
47.675653 |
1 |
| Eugene Kiperman |
47.326031 |
1 |
| Paul Pam |
47.075464 |
1 |
| John Davies |
46.934907 |
1 |
| Evan Custer |
46.705642 |
3 |
| John Klaben |
46.388971 |
1 |
| Michael Behrens |
46.386743 |
1 |
| Karen Didisse |
46.200781 |
1 |
| Greg Ehrensing |
46.059191 |
7 |
| Michael Fleishman |
46.022073 |
1 |
| Michael Sapper |
46.021122 |
1 |
| Ingvard Jakobsen |
45.92134 |
1 |
| Scott Aster |
45.664148 |
1 |
| Hilary Hardcastle |
45.574498 |
1 |
| Lora Oehlberg |
45.312669 |
1 |
| Fritz Menninger |
45.196848 |
1 |
| Linda Moore |
45.049416 |
1 |
| Michelle Alderson |
44.573356 |
1 |
| Stew Hintz |
44.278742 |
1 |
| Jorg Reinert |
44.149394 |
1 |
| Clark Maxfield |
43.915278 |
1 |
| Gina Pricco |
43.444949 |
1 |
| Trish Krantz |
43.316599 |
2 |
| Gwen Juha |
43.186931 |
1 |
| Scott Drumm |
43.089264 |
1 |
| Davia Jorgevien |
42.96396 |
1 |
| Russell Green |
42.571316 |
1 |
| Joanne Yim |
42.536286 |
1 |
| Wai Keung Chu |
42.474906 |
1 |
| Michael Robinson |
42.459901 |
8 |
| Charity Masaitis |
42.383671 |
1 |
| Alex Solmatnikov |
42.052499 |
1 |
| Frederick Lee |
41.95215 |
1 |
| Rhonda DeWeese |
41.609399 |
1 |
| William Morris |
41.528312 |
1 |
| Vicki Woolworth |
41.516797 |
2 |
| Carl Williams |
41.424592 |
1 |
| Phil Mosbacher |
41.367765 |
1 |
| Charles Graves |
41.09152 |
1 |
| Joe Scarborough |
41.090119 |
5 |
| Julia Doubson |
40.685579 |
1 |
| Terry Farrah |
39.649567 |
4 |
| Julie Pohl |
39.433838 |
1 |
| Jeff Dickert |
39.337118 |
2 |
| Leigh Bailey |
39.31133 |
1 |
| Stefan Stefanov |
38.834263 |
1 |
| Johanna Merriss |
38.605539 |
6 |
| Frances Vyse |
38.435681 |
1 |
| Maria Hastings |
38.34137 |
1 |
| Ana Herreros |
38.213197 |
2 |
| Leslie Minarik |
38.156921 |
6 |
| Laslo Varga |
37.922154 |
1 |
| Nigel Killeen |
37.827557 |
2 |
| Moss Aubrey |
37.44148 |
1 |
| Anne-Marie Koivikko |
37.364609 |
1 |
| Judith Sapp |
37.353462 |
1 |
| Wes Erck |
37.32578 |
1 |
| Mark Manning |
36.948951 |
1 |
| Ilan Omer Shahar May |
36.824665 |
1 |
| Jennifer Kerr |
36.689554 |
7 |
| Oleg Shakhnovsky |
36.642766 |
3 |
| Nie Laginova |
36.556364 |
2 |
| Jim Fish |
36.266744 |
14 |
| Saku Sinkkonen |
35.984999 |
1 |
| Edwin Gookin |
35.664095 |
2 |
| Wera Sinkkonen |
35.625149 |
1 |
| Fran Armstrong |
35.590896 |
1 |
| Marsha Jacobs |
35.471397 |
4 |
| Dave Petty |
35.411059 |
2 |
| David Jorgensen |
35.301328 |
3 |
| Hannon Didier |
34.859175 |
1 |
| Scott Novotny |
34.728177 |
1 |
| Emil & Ragnar Borg |
34.39813 |
1 |
| Charles Maich |
34.37838 |
1 |
| Andrey Losev |
34.309982 |
1 |
| Jeff Lanam |
34.200554 |
11 |
| Trevor Price |
34.050321 |
1 |
| Cecil Conkle |
33.703142 |
1 |
| Brian Tennant |
33.453393 |
1 |
| Richard Opsahl |
33.343845 |
1 |
| Rod Sinks |
33.333211 |
1 |
| Kevin McCarty |
33.147678 |
3 |
| Marina Keating |
32.508922 |
1 |
| Joan Roos |
32.382555 |
3 |
| Nathan Baker |
32.219271 |
1 |
| Kerie Raymond |
31.411083 |
1 |
| Gill Bailey |
31.355981 |
1 |
| Reta Roe |
31.056701 |
1 |
| Frank Porter |
30.995181 |
1 |
| Donna Gookin |
30.888235 |
1 |
| Scott Hann |
29.907965 |
1 |
| Elena Condes |
29.66505 |
1 |
| Robi Mulford |
29.594196 |
1 |
| Steve Beuerman |
29.266267 |
9 |
| Sherry Timmerman |
28.542587 |
1 |
| Peter McCorquadale |
28.294098 |
3 |
| David Meredith |
28.252906 |
1 |
| Rosemary Johnson |
28.215992 |
9 |
| Carl Moore |
28.140579 |
1 |
| Marieke Steuben |
28.086665 |
1 |
| Ryan Jeschke |
27.992517 |
1 |
| Harvey Friedman |
27.959451 |
1 |
| Melissa Griffiths |
27.64862 |
1 |
| Scott Donald |
27.606085 |
1 |
| Joe David Cowan |
27.412841 |
1 |
| Brownyn Caplinger |
27.39058 |
1 |
| Anne York |
27.371909 |
1 |
| Judith Opsahl |
26.925487 |
1 |
| Lena Eydelberg |
26.66906 |
1 |
| Justin Vandenbrouche |
26.402706 |
1 |
| Dean French |
26.229096 |
1 |
| Bill Gookin |
26.178919 |
2 |
| Lowell Moulton |
25.960807 |
1 |
| Ken Lew |
25.457008 |
2 |
| Terry Gleason |
25.040844 |
1 |
| Kevin Hinkley |
24.500102 |
1 |
| Terri Hunt |
24.500102 |
1 |
| Beth Dixon |
24.415837 |
1 |
| Shirley Donald |
24.403247 |
1 |
| Natasha Doubson |
24.153549 |
3 |
| Dieter Elhardt |
23.900336 |
1 |
| James Proudman |
23.673964 |
1 |
| Judy Koehler |
23.440497 |
8 |
| Kevin Perko |
23.069793 |
1 |
| Vladimir Cherepanov |
21.884619 |
1 |
| Nancy Lindeman |
21.177954 |
9 |
| Kate Sorenson |
21.086899 |
1 |
| Katy Robinson |
20.431733 |
1 |
| Cahn Family |
20.303387 |
1 |
| Jimmy Chung |
19.439529 |
2 |
| Barbara Robben |
19.160189 |
1 |
| Glen Cafferty |
18.371431 |
2 |
| Ananda Ranasinghe |
18.362613 |
1 |
| Rachel Erin |
17.603948 |
1 |
| Jessica Tzbia |
15.599214 |
1 |
| Tom Welte |
14.793584 |
1 |
| David Irving |
13.343283 |
1 |
| Jim Masters |
12.34186 |
1 |
| Jane Parody |
12.195323 |
1 |
| Harold Lischner |
10.000684 |
1 |